This article may contain affiliate links. If you buy some products using those links, I may receive monetary benefits. See affiliate disclosure here
Most of us already know how to check the page load time of a website, including that of WordPress. There are several online tools for that, like Pingdom Tools, GTmetrix, SpeedVitals, etc. You can also check it from your side from the browser with Chrome Developer Tools.
However, the page load time only gives the total time it takes from initiating a request and the browser rendering the response. It does not exactly tell us how long it takes for the server to process the request.
There is also something called server response time, or TTFB (Time to First Byte), but it includes network latency as well. Even if the server performs fast, TTFB can still be slow due to long latency and DNS issues.
Both page load times and TTFB are measured from the client's end.
Why it matters?
So, to accurately know how well your server performs, you need to check the server-side execution time. That is, the total time it takes for the server to run the script from start to finish. Nothing else.
It is measured from the server itself, not from the client's end.
So, this measurement is unaffected by network issues, DNS resolution delays, CDN cache misses, client side renderings, and so on. It shows pure server performance for a given request.
In this post, I will show you how to measure the boot time and server-side execution time for a WordPress site.
Measuring WordPress Boot Time
WordPress is a software written in PHP. So effectively, we're measuring the PHP execution time itself. PHP gets executed every time a WordPress resource is accessed, such as a post, page, archive, REST API route, admin ajax request, etc.
What is Boot Time
WordPress has a request cycle. It involves loading the config files, loading the WordPress core, PHP classes, loading the plugins and themes, functions, and finally processing the request and sending back the response.
Bootstrapping, or simply booting, is only the first part of it. It involves:
- initializing the config and the WordPress Core functionalities
- loading the plugins
- loading the active theme
It does not involve:
- theme template file execution
- major database queries, for instance, retrieving post data
- HTML response generation
- plugin and theme hooks used during HTML output generation
- PHP cleanup tasks
- ...and more
How to measure it
There is an event, or an action hook that fires right after this phase - wp_loaded. We can hook a function to it to get the time when the booting is finished.
Before that, add a constant to the wp-config.php file to get the start time. Why? Because the config file is one of the first files that WordPress calls in every cycle.
So, at the top of the wp-config.php file, add this line:
define('BOOT_START_TIME', microtime(true));Now in the functions.php file of your active theme, add the following:
function check_boot_time() {
    $boot_end_time = microtime(true);
    $boot_time = ($boot_end_time - BOOT_START_TIME)*1000;
    file_put_contents(ABSPATH . "/../times.txt", $_SERVER['REQUEST_URI'] . "(boot_time): " . $boot_time . "ms \n", FILE_APPEND);
}

add_action('wp_loaded', 'check_boot_time');
The function check_boot_time() will be called at the end of bootstrap phase. It writes the time in milliseconds to a file named time.txt. It is located outside the WordPress public directory, so it won't be accessible to anyone. Only you can read its content.
Measuring the execution time
The execution time includes the boot time, and the rest of it. So it gives the total time.
There is another action hook called shutdown that we can use to measure it. The hook is tied to PHP's built-in function register_shutdown_function(). It fires just before the very end of PHP execution, including cleanup tasks. So, this hook is more accurate than calling microtime() at the bottom of the index.php file.
Here is how you can hook to this action:
function check_exec_time() {
    $exec_end_time = microtime(true);
    $exec_time = ($exec_end_time - BOOT_START_TIME)*1000;
    file_put_contents(ABSPATH . "/../times.txt", $_SERVER['REQUEST_URI'] . "(exec_time): " . $exec_time . "ms \n", FILE_APPEND);
}

add_action('shutdown', 'check_exec_time');
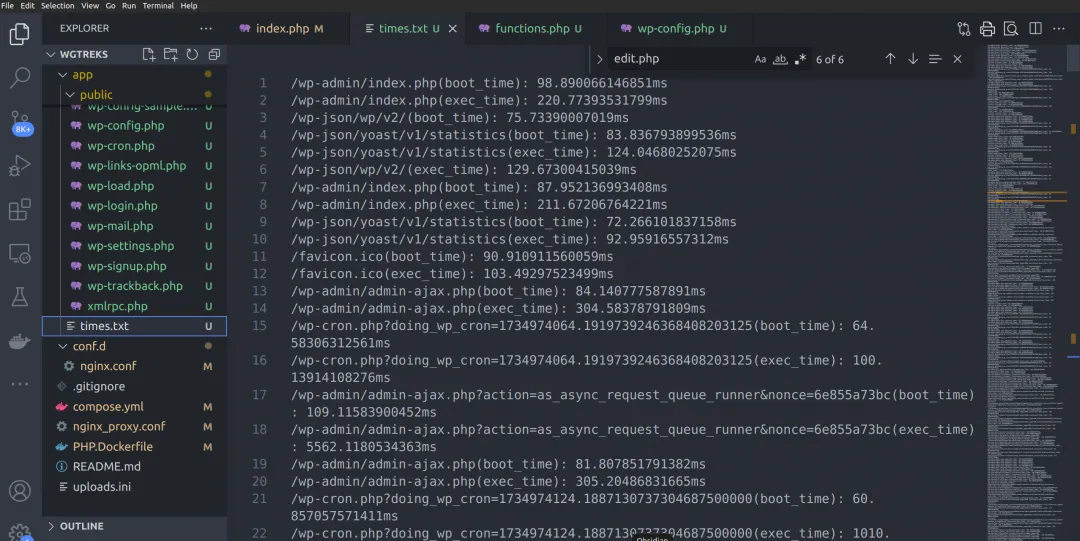
This is how the file looks like when opened in VSCode:
As you can notice in the above screenshot, the result contains a lot of other requests as well, like /wp-json/, /wp-cron, /admin-ajax, etc that clutter the file. These are side requests that WordPress automatically makes when you request main page.
We can easily omit those requests from times.txt by adding a simple function to check the request URI. So, here is the full snippet to add to the functions.php file:
function is_ajax_cron_json() {
    if(strpos($_SERVER['REQUEST_URI'], "/admin-ajax") !== false) {
        return true;
    }
    if(strpos($_SERVER['REQUEST_URI'], "/wp-cron") !== false) {
        return true;
    }
    if(strpos($_SERVER['REQUEST_URI'], "/wp-json") !== false) {
        return true;
    }
    return false;
}

function check_boot_time() {
    if(!is_ajax_cron_json()) {
        $boot_end_time = microtime(true);
        $boot_time = ($boot_end_time - BOOT_START_TIME)*1000;
        file_put_contents(ABSPATH . "/../times.txt", $_SERVER['REQUEST_URI'] . "(boot_time): " . $boot_time . "ms \n", FILE_APPEND);
    }
}

add_action('wp_loaded', 'check_boot_time');

function check_exec_time() {
    if(!is_ajax_cron_json()) {
        $exec_end_time = microtime(true);
        $exec_time = ($exec_end_time - BOOT_START_TIME)*1000;
        file_put_contents(ABSPATH . "/../times.txt", $_SERVER['REQUEST_URI'] . "(exec_time): " . $exec_time . "ms \n", FILE_APPEND);
    }
}

add_action('shutdown', 'check_exec_time');
Some Test Results
I tried these methods on a local WordPress site, set up using Docker. You can find the details here.
Fresh WordPress Installation
- WordPress 6.7.1
- TwentyTwentyFour theme
- Fresh installation, no active plugins
- Opcode cache was enabled, other than that, no other caching was in place
- nginx/1.27.2
- PHP 8.3.12
- MariaDB 11.5.2
| Page | Boot Time (ms) | Exec. Time (ms) |
|---|---|---|
| Blog (frontend) | 34.69 | 190.37 |
| Sample Page (frontend) | 37.88 | 128.87 |
| Single Post (frontend) | 39.29 | 155.70 |
| /wp-admin/index.php | 27.55 | 88.71 |
| /wp-admin/edit.php | 30.60 | 172.95 |
| /wp-admin/post.php?post=47 | 33.59 | 250.35 |
| /wp-admin/plugin-install.php | 31.42 | 2343.66 |
With no plugins installed, the median boot time was 33.59 ms while the median execution time was 172.95 ms.
After installing essential plugins
Then I installed and activated a few essential plugins:
- Antispam Bee
- UpdraftPlus
- Sucuri Security
- Yoast SEO
- WPForms Lite
- WP Mail SMTP
- EWWW Image Optimiser
| Page | Boot Time (ms) | Exec. Time (ms) |
|---|---|---|
| Blog (frontend) | 73.56 | 253.23 |
| Sample Page (frontend) | 69.83 | 385.75 |
| Single Post (frontend) | 73.81 | 208.67 |
| /wp-admin/index.php | 98.89 | 220.77 |
| /wp-admin/edit.php | 103.58 | 331.61 |
| /wp-admin/post.php?post=47 | 76.15 | 419.64 |
| /wp-admin/plugin-install.php | 88.48 | 2672.69 |
- Median Boot Time: 76.15 ms
- Median Execution Time: 331.61 ms
Results using Chrome Dev Tools
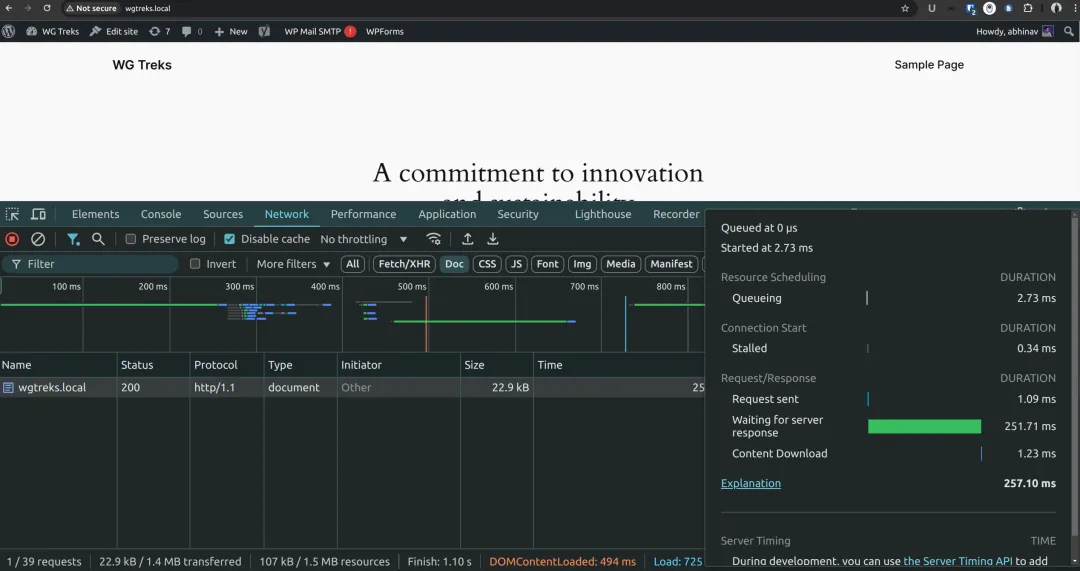
You can get an approximate server response time (execution time) using Chrome Dev Tools as well. You only need to enable the Waterfall option, then hover over the bar corresponding to the page document. There you will see something called 'Waiting for Server Response'. It is the total time the browser spent waiting for the first byte from the response (TTFB).

Since I am testing the site on localhost, there is no overhead of DNS lookup, SSH handshake, or network latency.
| Page | Exec. Time (ms) |
|---|---|
| Blog (frontend) | 251.71 |
| Sample Page (frontend) | 195.67 |
| Single Post (frontend) | 229.28 |
| /wp-admin/index.php | 208.22 |
| /wp-admin/edit.php | 351.92 |
| /wp-admin/post.php?post=47 | 423.91 |
| /wp-admin/plugin-install.php | 2430 |
Conclusion
You can see that both the boot time and execution time doubled after installing a few plugins. The median score - 331 ms - was for the 'All Posts' page, which lists the posts in the admin area. The frontend pages also took more than 200ms consistently.
Also, for some reason, the 'Add New Plugin' page (plugin-install.php) took more that 2 seconds to load. The sluggishness was quite evident when loading that page in the browser.
Maybe this is the reason why it is not wise to use WordPress without proper caching enabled, especially on the frontend where you can get multiple visitors simultaneously. While in the backend 200-300ms can be okay because you are the only one accessing it.


